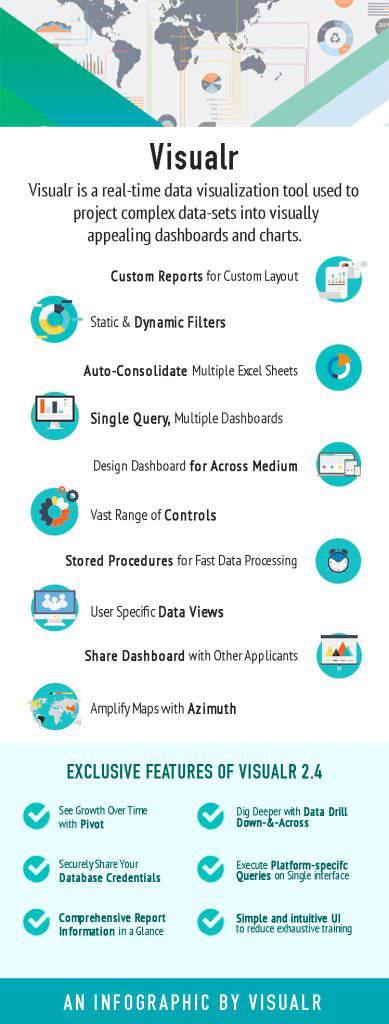
If you’re inundated with data clutter and intend to make a clear visual business sense out of it through smart dashboards & charts, Visualr is there to help you out. It allows you to integrate various data sources including MS Excel worksheets, and generate queries using the formula you have developed. You can apply static and dynamic filters to sift through your data sets and apply a wide range of controls to maneuver through them. The queries created are independent and may be used across multiple dashboards to streamline the operations.
Visualr enables a lightning fast data processing by allowing you to save and implement stored procedures for the operations reiterated frequently. You can design customized layouts for generating personalized reports, and enhance their visual theme adding your own bit of creativity. The geospatial dashboards may be amplified with azimuth, rendering an extra layer of interactivity to them.
With the new Visular 2.4, you can securely share your database credentials along with your team members, carry out platform specific queries using a single interface, and take a deep tour into your data sets using the data drill down-and-across features. Last but not the least, you’re able to access comprehensive report information right through a single click of your mouse.
Visualr 2.4 – Make The Best Out Of Your Data
August 1, 2017
A dedicated full-time digital marketer with 12+ years of experience in the industry. Since 2015, he has been successfully running infographicportal.com, a platform that showcases high-quality infographics across various topics. Nagendra's expertise lies in creating and executing effective digital marketing strategies that drive engagement and growth. His passion for visual storytelling and commitment to excellence has made him a respected figure in the digital marketing community.