Infographics are definitely attention grabbers online, but not all are living up to this extent too. It is important for you to create informative data visualization in it with strong and quality approach. This is the reason, why many infographics are failing to live up to the expectations.
In fact, it is not a big task to turn your data visualization stronger, interesting and attentive for your readers. It needs more attentive approach and understanding well your target audiences. There are 4 factors to observe in this context and those are explained below in detail for you:
- Data always play a vital and interesting role in your infographic. This data is something that is used wisely for visualization in the presentation. It will play as a spine for your chart or graph. It is highly imperative here for you to research and gather valuable and reliable data. Also, keeps this information in the form of data quite serene in a way leaving no room for your reader for any queries and doubts in it. Check and recheck your data used in the visualization until you feel it perfect, flawless and reliable. Without valid and useful data, your visualization will be equal to dead.
- Story telling is another important part of your data visualization in the infographic. You have to create a story from the used data and create story telling complementing well your data used in the visualization. This will keep the flow enticing and reader will instantly connect well with your story as well as with the used data too. Also, do not forget to add your message in it that is intended to deliver to your target audiences with the help of this infographic. Make it sure that your message and story are complete and easy to understand for your readers.
- Goal and it is important for you to have a goal for this visual presentation. Create a serene goal or purpose and same should be laced gently within the story as well as in the data visualization. When you have a pre-determined goal for the presentation, then you will definitely come up with the valuable questions and answers within your story telling. Yours story as well as data should be used wisely as answers for those questions in the visualization. This will turn the presentation enticing and reader will come to understand your view point easily.
- Design is another important aspect that needs perfect attention from you. When yours data is ready and story is ready, then the design part will come to front seat. It is important here for you to design the visualization with respect to the data and storytelling. Decide well, where a chart suits well and where a graph suits well in the visualization to complement well the storytelling. Make it sure that your design is simple yet attractive at the same time keeping it easy to understand too. Do not make it too complex and design it keeping in mind a common reader. Also, select colors, icons and some more in a way the presentation can be appealing and attractive.
Data Visualization in Infographics with Effective Approach
It is proven many times that storytelling is not all about words and images and it can be made more effective using data visualization. Data visualized in the various forms can make your reader understand the data with precision besides connecting him or her well with the storyline. Very often, we collect good volume of data while writing a story, but fail to present it in the form that is easy to understand for your readers. Here, visualization of your collected data in the best format can help you well with this aspect.
Importantly, visualization is your approach in order to make your data laced well within your story line at the same time to make it easy for all to understand, but wrong visualization of data can be dangerous too. Let us see all the available types of graphs and some more those can add up well to your data visualization:
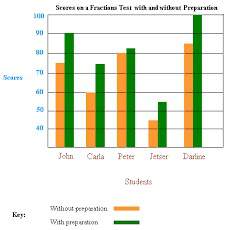
- Bar Graph: Column charts or bar charts are very familiar for many of us and these are perfect help in your data visualization for the data comparison needs. Also, these are more effective option to explain changes from time to time basis too, but these are not perfect match while the change to be explained is very little too.
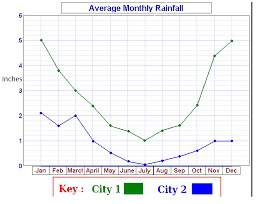
- Line Graph:This line graph option is very often proven as best practice to explain changes from time to time. Importantly, while the change is very minute this line graph representation is far better than bar chart too.
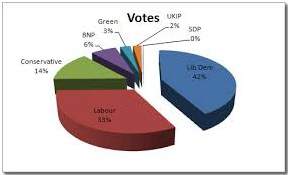
- Pie Chart: Pie chart is definitely a best data visualization choice, but very often people are seen misusing it too. This type of representation should be used on specific areas, where parts of the whole entity need explanatory presentation. Also, make it sure that your pie chart representation in various segregations should be counted to the total of 100% for sure in your data visualization.
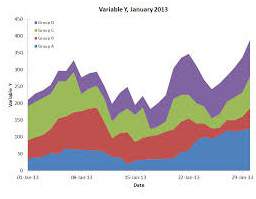
- Area Graphs: This is another valuable choice that can add up well for special data visualization needs. It will offer the best representation of several categories and their contribution in various forms from time to time basis.
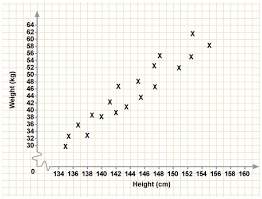
- Scatter Graph: This kind of representation is useful for presenting correlations or relationships between or among the various things using the XY plots effectively in the graph. This type will allow you to spot or identify outliers of the data effectively.
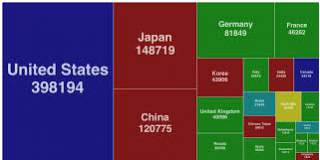
- Tree Map: This is another important and useful choice for your data visualization and this is very effective and apt for presenting your data hierarchy and ratios of the various components.
Data Visualization Mistakes in Infographics
Visualizing data in your infographics is very important part of its effective creation. Here, having correct data is one side of coin while the other side of the coin is all about visualizing data with more telling effect keeping in mind your readers. This kind of right data with right visualization will always be successful in complementing your story telling in the infographic.
Readers will also find it easy to understand the exact idea of the topic and used data. Very often, we see people create this data in infographic in the form of jigsaw puzzles, which will fail to meet the desired results and output through it. Importantly, your data and infographic fail to deliver, what it is intended by you for your readers. Let us see some of these data visualization mistakes in order to avoid them from the usage into your infographics:
- Keeping math equation in the infographic data visualization is something tricky, which can reach to a set of readers while the rest find it hard to understand. For example, take pie graphs for the representation of the data. Here, whatever the kind of segregation taken and shown in the pie graph should be made easy to understand at the same time making it sure to total bifurcation is equal to 100. If you keep this pie graph with too many bifurcations in the form additions and subtractions, then it is reader, who will find it hard to digest. It is always a best practice to avoid math equations in your data visualization and keeping it in simple representation can let it connect well with readers easily and quickly.
- Comparison of data is very common perspective very often in our infographics. Here, my suggestion is that to keep this comparison simple and never try to use pie graph for this purpose. Your comparison is intended to display major differences between two aspects. Such comparisons will be easy to understand for all through bar chart than the pie graph. Nowadays, readers can’t afford to spend much time to read and understand your infographics and any such practices will definitely witness ignorance from the readers. So, keep your data comparison visualization simple and easy to understand with a single glance and bar charts are definitely your wise choice here than pie graphs.
- Larger data in the various forms is very often necessity for visualization within your infographics. It is very often unavoidable situation for many too. If there is too much data within your data visualization, then it is reader who will be lost within data. It is highly imperative at this kind of situations to be attentive with your data visualization. Present it with less complicated nature and keep it as simple as possible. Nowadays, we have many different charts, graphs and other options available for this purpose. Check all possible alternatives and use a right option that is simple and easy to connect well with your audiences.
- Labels will play a vital part in your data visualization. Always take time to label your graph axis with right word that is easy to understand for your readers. If you made any mistake with this labeling process or ignored to label the graph axis, then it is not possible for your reader to understand your visualized data.