Adding infographic into marketing strategy is not a new thing now over the internet. A recent report said that the infographic usage has been improved more than 800% over the net. This is proven as a best addition to the present day content marketing too. Visual content is powerful while infographics are very easy to create than any other.
Present day 65% of the netizens are more into this kind of visual content for their information needs too. Let us see some of the valuable tips those can make your infographic strategy huge success for you:
- It is always a best practice to look around before proceeding with the infographic task in your hand. Check some of the recent successful content online and find out the exact reason(s) that made it into a great success. This observation will give you what all features and points should be there to make your content similar success.
- Your idea to present the visual content is something that makes your output enticing. It is imperative to come up with a unique idea for your infographic in order to make it special for your target audiences online.
- Data on your content should be of top notch quality without fail. It is always important to gather genuine and relevant data for your visual presentation through researching wisely online. This genuine data is always appreciated by the online community and make this as your necessary accessory in making your output smashing hit online.
- It is essential to design your visual content simple yet interesting. Complex designs will fail to connect well with your target base. It should be simple at the same time being capable enough with flawless storytelling in it.
- The story woven around your idea and used data should always be enticing. The story telling with effective approach makes your data more appealing and it will connects instantly with your target base too.
- Size of your infographic is another important aspect that deserves special attention from you. Make it sure that this size is ample in a way not letting it too small or too large.
- It is important to optimize your visual content through adhering well with SEO guidelines. Also, make it more interactive through embedding information enriched links wisely in it.
Topic Creation for Your Infographic
While intended to create an infographic, always remember that the topic selection is vital. Your infographic will not cater well to the purpose and fails to gain the attention from audiences, when topic is not enticing. Here, this topic selection should be aimed through the defined goals and target traffic interests. These two aspects can lead you to come up with the best topic for your planned infographic design and creation.
Let us see some of the useful tips in this context those can help you to find out the best topic easily for your requirement:
- It is important that the topic chosen should be newsworthy. This is possible through checking and following the latest trends and Facebook and twitter feed can be a best help here to find out these trends appropriately for your requirement. This approach will make your topic as a better sync to the people what they’re looking for.
- Information Graphic or Infographic name itself indicating that its aim is to provide educating information. If you chose a topic that is like in the form of education will easily connect well with your target audiences. Also, this will result into addressing well the needs and interests of your target traffic too.
- Sometimes, it is a good idea to involve your audiences in to this topic selection too. Ask your user base about their interests and what they’re looking forward to as valuable information from you. This will result into the creation of the best user friendly topic enriched infographic for you that can acquire good feedback from your target traffic successfully.
- It is important that your infographic should offer cutting edge information through it. This kind of approach will always be appreciated by the online community. Check for the kind of changes is at present at the horizon of your field. Emerging techniques and technologies are always a best idea in this context for your topic too.
The above mentioned tips might help you to come up with the best ideas for your future infographics design. Always keep in mind that the user base interest should be your paramount attention here to decide on this topic too.
Select a Popular Topic from Social Media to Create a Best Infographic
Nowadays, social media is all about people and their attention and interest on the various topics. The various social platforms online at present are evolving as a mouthpiece for public to express their opinions and interests. So, this place will give you an idea about, which content currently connected well with the public along with exposing their ideas and interests quite serene. So, you will definitely find a best topic for your infographic from these social platforms that can connect well with your target audiences. There are 5 important points to be followed here to find out the best topic for you:
- Social media is all about the people and how they all carrying themselves on their own. They might be talking at these platforms about your product and similar ones. This will be a best useful data for you to understand the customer base interest and opinion about your product or service. Many top brands are currently using a customized tool or application to analyze this data available from the people from the various social platforms too. You can do it manually too through checking the comments, likes and some more at these social platforms, but takes time. Eventually, you will get a best idea and overview about your target audiences and you will get a best topic for your infographic from this data too.
- As said above the data available online is a best source for you to find out the suitable topic for your infographic. Here, we’ll further work little on this data in order to make good use of this data for your topic finalization. This will be done easily through apps and tools those designed for this purpose, but you can try it manually too. Check the entire noise made by public at the various social networks. Segregate it in the form of niche, your product and into some more ways. Create a benchmark that can lead to success and co-relate it with your available data. This kind of data evaluation will offer you further more insight on the task before to you.
- Now, you have well analyzed data in your hand. Identify some of the social presences those are talking more on your niche and talking more about your product. Try to contact them online. Build some healthy relationship with them. This will develop into network evangelists for your brand. Now, you have your supporters and people those are into your niche. It will give you further more insight and approach to make good use of your data in hand.
- The next step in the process is to identify strong and weak demographic locations for your product basing up on the data available for you that is collected from the social networks. You can use data visualization for this purpose, which can offer you serene idea on this context.
- Now, you have salient aspects about your product social outreach and customer base opinions along with strong and weaker zones too. Formulate a strategy basing up on this available data and come up with a best topic and strategy for your infographic.
Existing Blog Post into Infographic
Content marketing is definitely strenuous as every day you will require many new topics and ideas to present your audience. Very often, we end up having no ideas or ran out of ideas for the content after publishing many topics and ideas. Do not let it be the stand still point for your content marketing strategy while there is a chance to repurpose your existing blog into a beautiful infographic. It is nothing wrong as this approach will help you add some more visitors and prospective customer base to your site those are more into visual content. Also, people who read this textual format will be happier to see its visualized version too.
Let us see how best we can repurpose existing blog into infographic:
- Select a recent popular blog post for this repurposing activity. Now, select a type of infographic from the popular 9 types basing up on the blog post topic and idea. Now, come up with a best layout for the selected type too.
- It is time now to select text from the existing blog post for the infographic. Check your planned type and layout for the visual content design. Select the text from the blog post in a way layout and information can complement each other well.
- Now, time to care about data from the blog post and pick the data that is a best match for your planned infographic. It is imperative that your infographic should hold some data that can scaffold well to your textual content. Present this data in the suitable data visualization format on the visual content.
This is a best way to make good use of your popular blog posts through turning them into the effective visual contents. It is not a tedious process through selecting right templates, icons, colors and backgrounds. This will improve your content marketing strategy to a good extent at the same time offering the best return over investment too. Also, this is a best practice to add some more traffic to your site too. There are many people those are particularly into visual content and these people will also add up into profitable traffic to your site with this approach.
Use Existing Customer Story in Your Infographic
Infographics are definitely driving force at present for the digital marketers. This kind of visual content seen always appreciated by users as well as by search engines too. Here, topic and storytelling are the real essence behind the success of this content strategy. People bored with the similar textual content that is available online with no difference. If this is presented through visual elements along with suitable little text in it, then it will catch the attention from all online. As the way this kind of content strategy is soaring high online, scarcity for the topics and ideas is at rise at other side too.
What kind of topic idea is better for this content strategy should be identified here by all the digital marketers. I suggest taking a new path that is not yet taken up by others. Use your existing customer(s) as story line for these infographics. Especially, while writing email newsletter considering the story of an existing customer with pictures can do wonders for yours business. Your existing and prospective customer base that is following your email newsletter or other content in the visual format will find it more interesting and reliable. A customer with own pictures telling about your product or service along with his or her experiences in the infographic can work well as a better content marketing strategy for you.
Infographic idea is definitely a wise approach. Here, it is very necessary to change your story telling step by step too. It will break the monotony with your user base. Sending similar topics and similar ideas will no longer hold any good for your marketing needs. If it is added with your customer base, then reliability factor will improve and such things sharing at the social media networks will turn into quite viral too. Definitely, this kind of new approach is worth trying into your digital marketing. Also, it is good to take written approval from the customer before publishing the infographic with his or her pictures and opinions too.
Viral Topics Sources for Your Infographics
Infographics are at present proven as the best visual content ideas for the present day digital marketers. Here, every infographic success is decided by the audiences based on the chosen topic and the kind of story telling intertwined in it. You can find out the best topics for this purpose from the best reliable sources online. Some of those are:
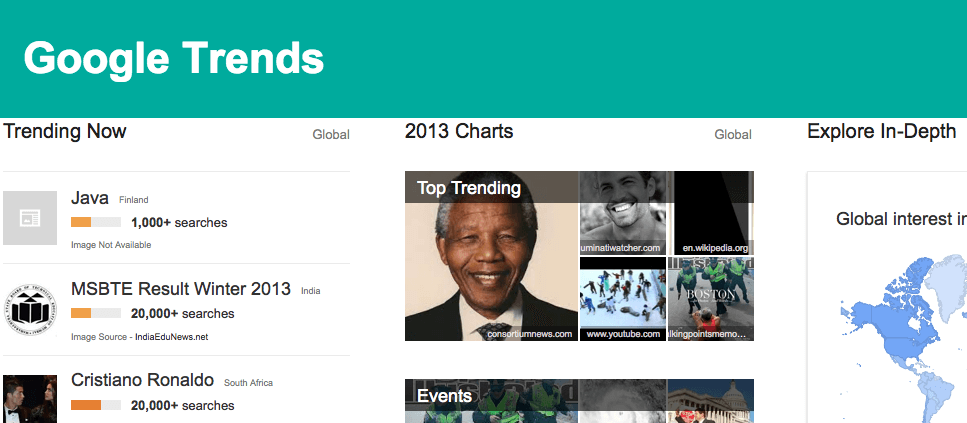
- Google trends is always your best source here to come up with a best topic for your visual content that could gain huge attention from your target audiences successfully. This will allow you to come closer with the latest trends all over the world or you can filter it country wide too based on your target geographic interest. The map on its right side will give you further more insight about the keyword and the engaged popularity for it too. You can avail multiple keyword comparison too from the right side of the trends page country wise. Definitely, topic selection from this source can turn your infographic into viral.
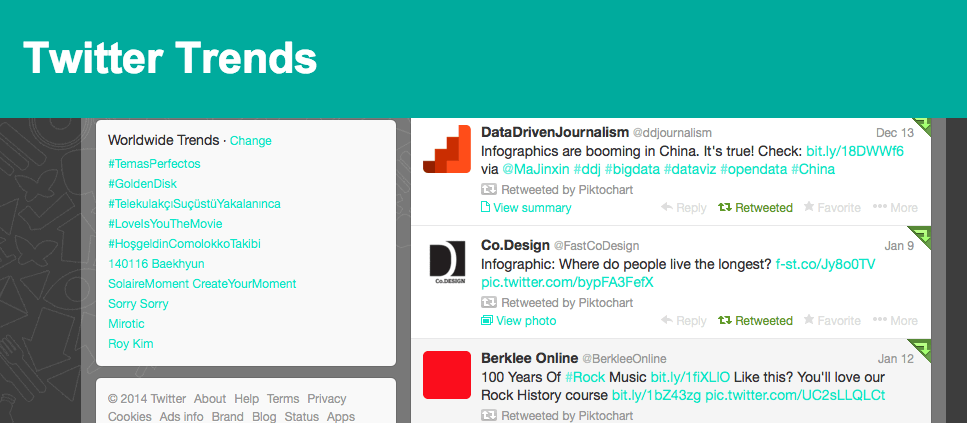
- Twitter trends are another place where you can come to know the best topic ideas for your infographic too. You will get at here top ten hashtag list and their topics. You can here too filter these trends global or country wide or city wide. Also, you can check the Twitter offering Tailored Trends those are generated for you exclusively based on your geographic location and the people you follow. Their Discover tab is additional help here to find out what is happening that can help you decide right topic for your infographic.
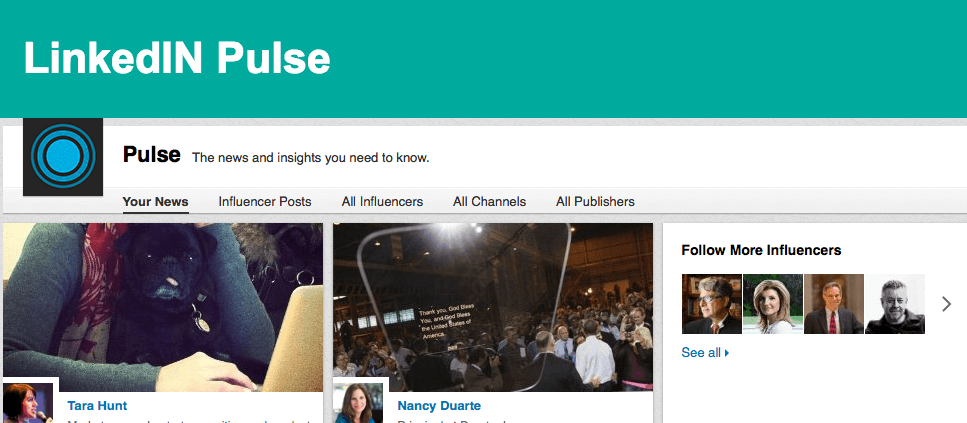
- LinkedIn Pulse is another help here to decide on your topic. Professional interest topics acquired through Pulse app or through email or through your account home feed will be good help to find out the best tending topic.
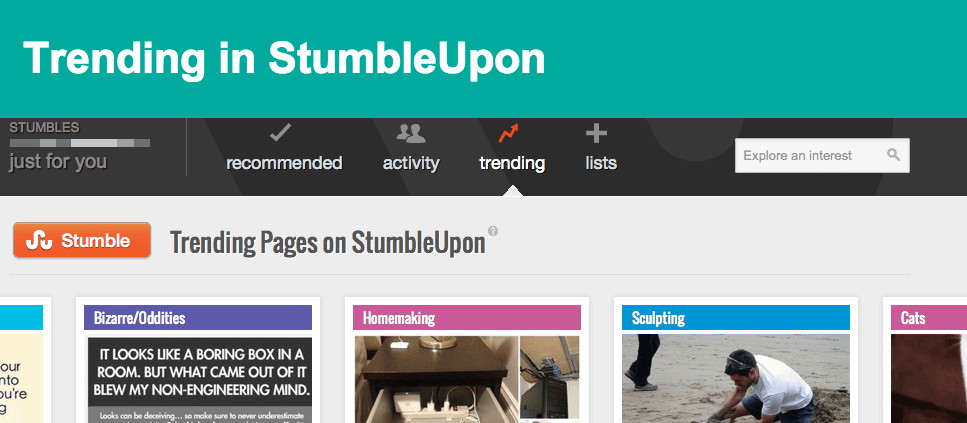
- Stumbled Upon Trending button is another reliable resource here to find out the hot websites, trending videos and images. This will give you a good insight about great reads those are appreciated and gained good engagement online. Perhaps, this could lead you to right thinking in deciding the topic as well as story telling idea for your infographic in a successful manner.
In addition to above, Feedly, RSS and some more similar resources might help you well to find out the best viral topic for your infographic too.
Images are Content Now through Infographics Trend Online
People looking into the information over the internet for a long. Here, their interest is changing down the line. Initially, it was textual content, later it was videos and now it is all about images. Time has been essence in everyone’s life. People finding it tough to spare extra time to read lengthy textual stuff and time taking videos. It is now images are their interest. Images with little text and added with more information is now sounding more apt for their information needs.
Information is definitely good in any form, but time involved in its gathering and reading is currently been very precious. Information is always plenty online and available in wide varieties of forms. People are now searching for their information that is in the form of interactive infographic. This interactive infographic offers a lot through it besides transporting the reader successfully to the best destination page that is with further more relevant info too.
This is making the user more inclined for it. Their aim is to check the information that is available in simple and quick to understand format rather to read. This is very well satiated through infographics. If the user needs further information, then go further through the link in it too.
It is time to go with the trend following the user interest. Your interactive infographic with right data and right embedded link in it can gain more attention to your business successfully. In fact, these are not tough to create too. There are plenty of tools, accessories and templates available to create them quickly and effectively. Here, it is very important to gather right data for its creation too.
Your right data added with right infographic creation approach can take your content marketing strategy success to the soaring highs. Infographics effective creation is nowadays made easy with the available free templates online too. Check the similar sites those are with free templates and images and this will help you a lot for your visual content generation needs. Try this latest content strategy to match well to the needs of your target customers.
Data Driven Journalism Using Infographics
News or information online nowadays proved as effective and quick way to connect well with readers through the usage of the infographics. Data driven journalism is the latest trend that is triggering huge attention from all in this world. Journalism is all about bringing facts to the people. Very often, these journalism topics need scaffolding facts with genuine data. If this data is presented in right format through visualization, then it is going to send right message to your readers.
Now, data driven journalism is slowly encroaching into the field of journalism for so many good reasons. News publications agencies are nowadays more into integrating genuine data into their articles and columns. It has been very common now in journalism to use data visualization elements, infographics, charts, graphs and many more. Here, three data journalism myths seen straining their approach and let us demystify these myths below:
- It is very commonly heard among circles that it needs to be a math wizard to turn into a best data journalist, but it is an absolute myth. Actually, it needs handling data that is in too many types of figures and it needs basic knowledge of mathematics to handle them wisely. Nowadays, there are wide varieties of tools available to manage this data that is in the form of figures to make them into more apt for the data visualization needs. Microsoft Excel will be a best example tool in this context. Data can be used with too many helpful shortcuts through MS Excel.
- Coding skills will help your data visualization more effective in data journalism, but it is another myth. Programming languages are definitely like foreign language and it needs detailed learning to master well. Here, it needs creating your data with more interactive and responsive for your readers. You can achieve it in your data journalism through using right data visualization options like graphs, pie graphs and some more. Also, add it with simple anchor linking strategy, wherever it needs in order to transport your reader to a place, where further information is available to acquire more insight on the topic. This kind of skill is enough to make your interactive data journalism output and it requires no coding knowledge at all.
- Gathering, processing and presenting data in right way in data journalism is a time taking procedure, but it is not. Definitely, journalism runs on deadlines and time is very important here too. Just gather the data that is trusted by you and make good use of it through the available online tools those can process and present your data at finger tips within no time. This kind of approach needs little bit familiarity with all the helpful tools available online for the data visualization needs. If you do little research on these tools, then your data journalism with data gathering, processing and presentation will be quicker always than what you thought.