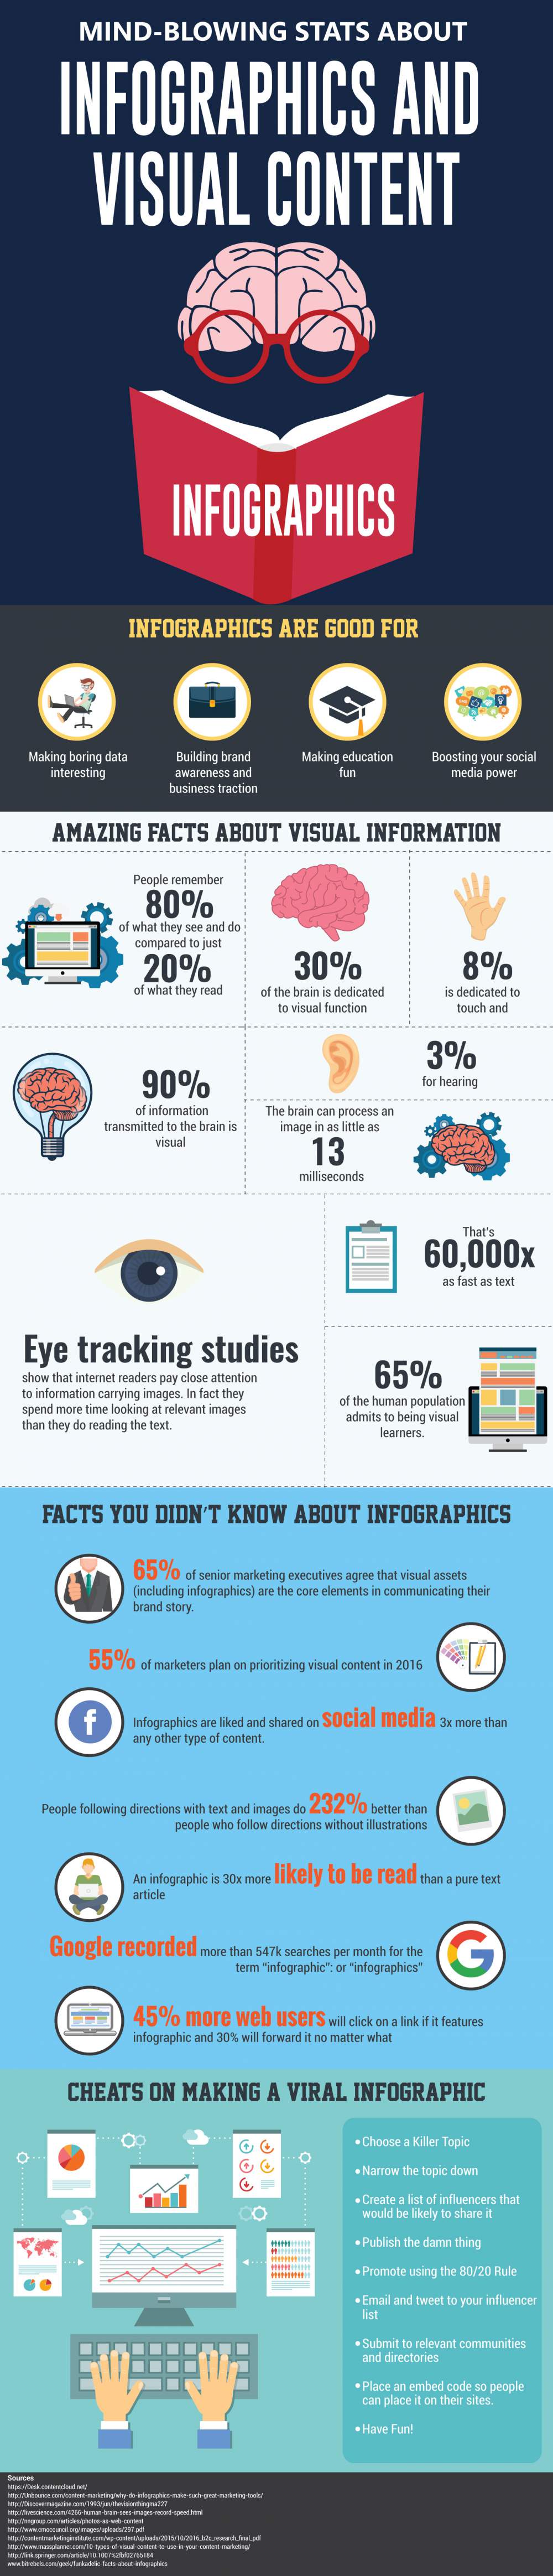
This infographic focuses on the way our brains are hardwired to love visual data and anything that has nice pictures and only a few words. The writing is on the wall, visual content will outstrip anything else you can put out and if you don’t get with the program you’ll be left behind.
This infographic looks at two major sets of data, how the human brain reacts to seeing images or visual content and the trends in visual content marketing going into 2016 and beyond. There is also a bonus section that details a few of the steps you should take to make sure all of your visual content hits a home run.
A few highlights are the fact that your brain processes images 60000x faster than text. Most of the world professes to be visual learners, remember 4x as much information when they see and do something than if they just read it. Want more, take a look at the full infographic.