Each year the Health and Safety Executive in Great Britain release their Health and Safety statistics. Bryan & Armstrong have turned these stats into a useful infographic giving a clear indication of how safe employees are since the 1974 Health and Safety at Work Act based on over 10 years of data. One of the most shocking stats from this infographic is that fatalities have actually increased year on year from 133 to 142 but despite this the UK remains the safest place to work in the European Union. When the UK is looked at against its peers in France, Italy, Spain, Poland and Germany as well as the wider EU-28 it constantly out performs better or in-line with comparators. The most common causes of non-fatal injuries in the UK was slips and trips, handling, lifting or carrying and finally being stuck by moving objects. The most common causes of fatal injuries was in construction, agriculture and recycling. Most deaths or serious injuries could be avoided if only employers implemented basic checks and measures to ensure equipment is kept in good order and employees have the proper education. 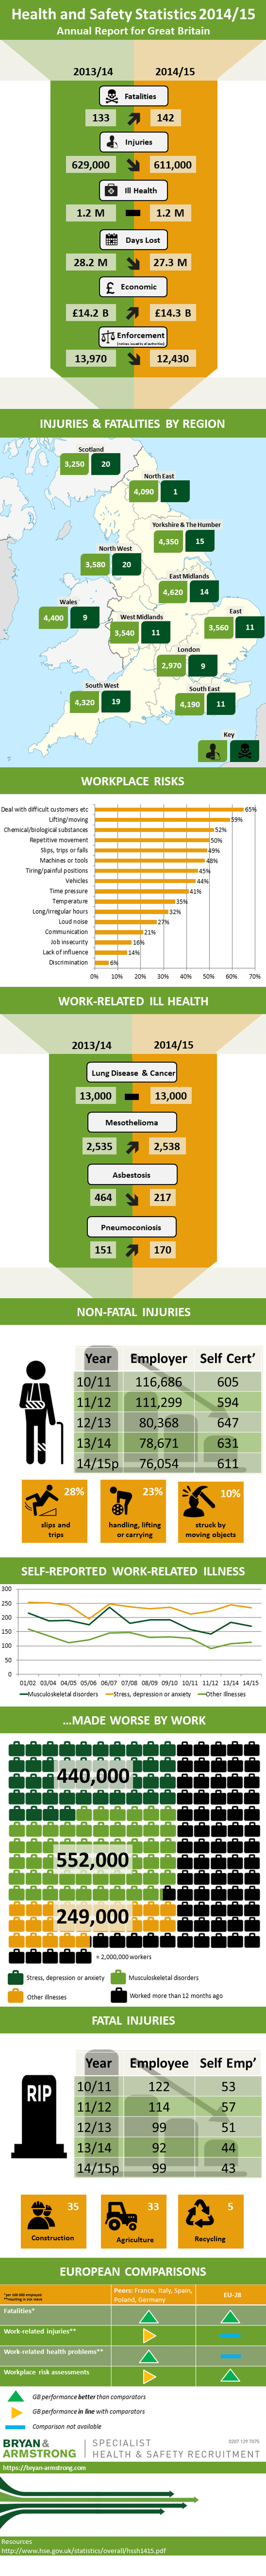
Infographic Source : https://bryan-armstrong.com/infographics/hse-health-and-safety-statistics-2014-2015/
HSE Health and Safety Statistics 2014/15
November 6, 2015