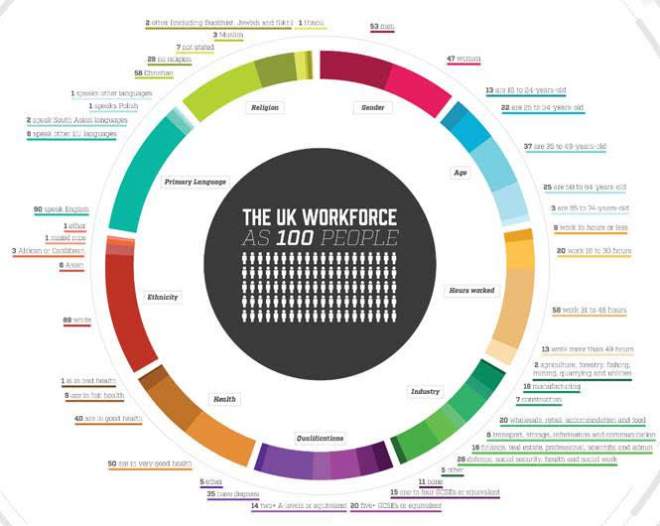
This infographic from office furniture and stationary suppliers, Viking, helps us to understand the make-up of the British workforce by visualising it as 100 people. This visualisation provides insight into areas where certain groups such as ethnicity, religion, and gender, are under- or over-represented in the British workforce.
The study for the infographic used census data from the Office of National Statistics, analysing nine different points, split into different groups in the UK’s population. Each group was calculated as a percentage of a whole and rounded to the nearest integer to give a number out of 100 for each element.
This study can now be used to analyse areas for improvement in the UK’s workforce, providing context for employers to carry out analysis on their own business and work to address any areas for improvement to create a more diverse workforce in their organisation.

Infographic Source: https://blog.viking-direct.co.uk/uk-workforce-100-people
Tags 100 People UK Workforce
Check Also
U.S. Sex Offender Statistics
This infographic provides a detailed analysis of registered sex offenders in the USA as of …
 Infographic Portal New Infographics Resource Portal
