According to research, mobile advertisements on social media can generate more than 1% click-through rate compared to traditional, with 0.05%. The efficiency of mobile ads can be traced back to users.
Now that consumers are keener to using their smartphones or other mobile devices to log-in to their social media accounts—60% of the users, to be exact—the number of potential customers has also increased.
With billions of active users on Facebook and millions more on Instagram and Twitter, it’s now up to you how and where to implement your mobile ad strategy, depending on your target market. There may be multiple platforms to choose from, but not all can give you the highest reach and ROI.
Connext Digital went deep into the rabbit hole to learn the mobile ads facts behind the numbers, as well as to present the various types of ads available for your business with this infographic below.
Infographic Source: https://connextdigital.com/blog/domination-mobile-ads-statistics-trends/
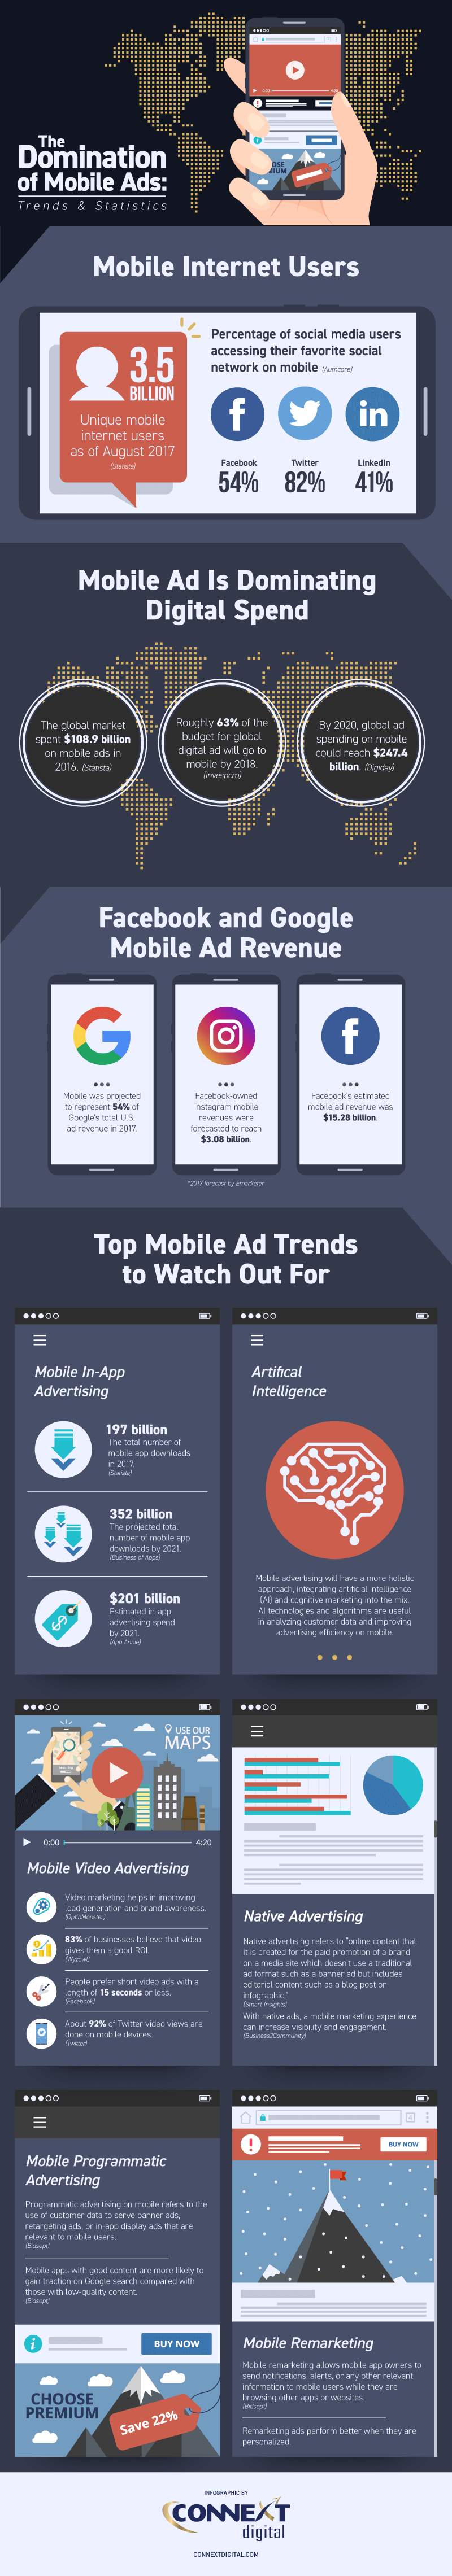
The Domination of Mobile Ads: Statistics and Trends
July 19, 2018