Email marketing is by far the most effective channel for businesses to communicate with their customers and prospects. Year after year, emails have proven themselves to be irreplaceable in marketing and growth strategies of businesses across B2B and B2C industries.
In fact, according to Emarketer.com, email marketing is not just the most effective channel for acquisition but also customer retention. It delivers a whopping 20% more retention rate than even the most popular social media channels. The endless studies only go to say that there is no way for a business to market without emails.
While it is one of the most effective marketing and sales channel, it comes with its own set of challenges. The first being getting people to subscribe to your emails, then nudging them to open your messages and read through them to convert or interact with your business in some way.
If this wasn’t enough, the digital world moving to mobile has only added to the existing challenges of executing an email marketing strategy that actually works.
The number of internet users accessing their emails on a day-to-day basis from mobile devices is nearly 1.7 billion; which is far more than the conventional desktop users that are just 0.9 billion in number.
This only goes to say how marketers will need to look into mobile-specific email strategies if they want results. And no, using a responsive email template won’t cut it anymore! Even though that’s the one tactic that most marketers swear by, with 2017 kicking off, you will need to go beyond the basic tweaks and truly understand the mobile consumer.
In this infographic, we’re sharing mobile email open statistics that will help your marketer create and execute a highly converting strategy. The industry insights provided include how responsive people are to emails received on their mobile devices vs. the desktop and what are the conversion rates seen by businesses.
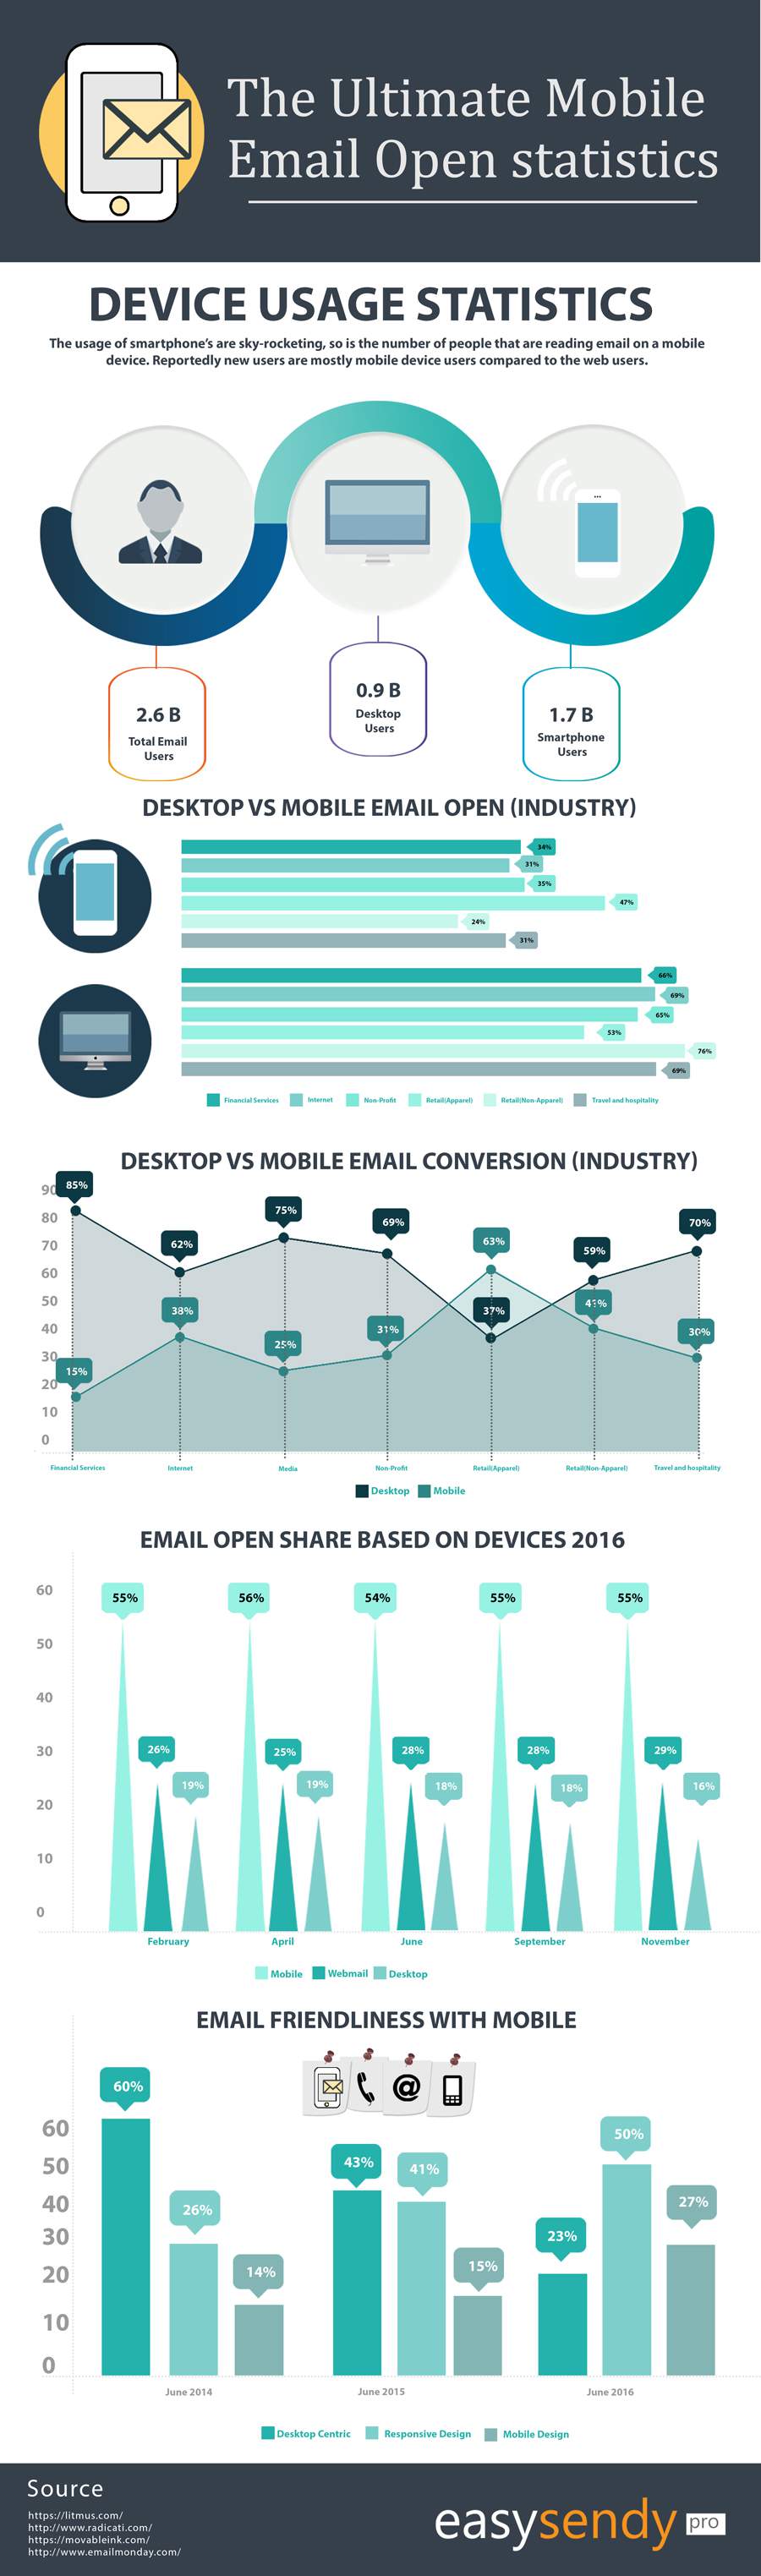
Infographic Source: https://easysendy.com/blog/mobile-email-open-statistics/
The Ultimate Mobile Email Open Statistics
January 17, 2017