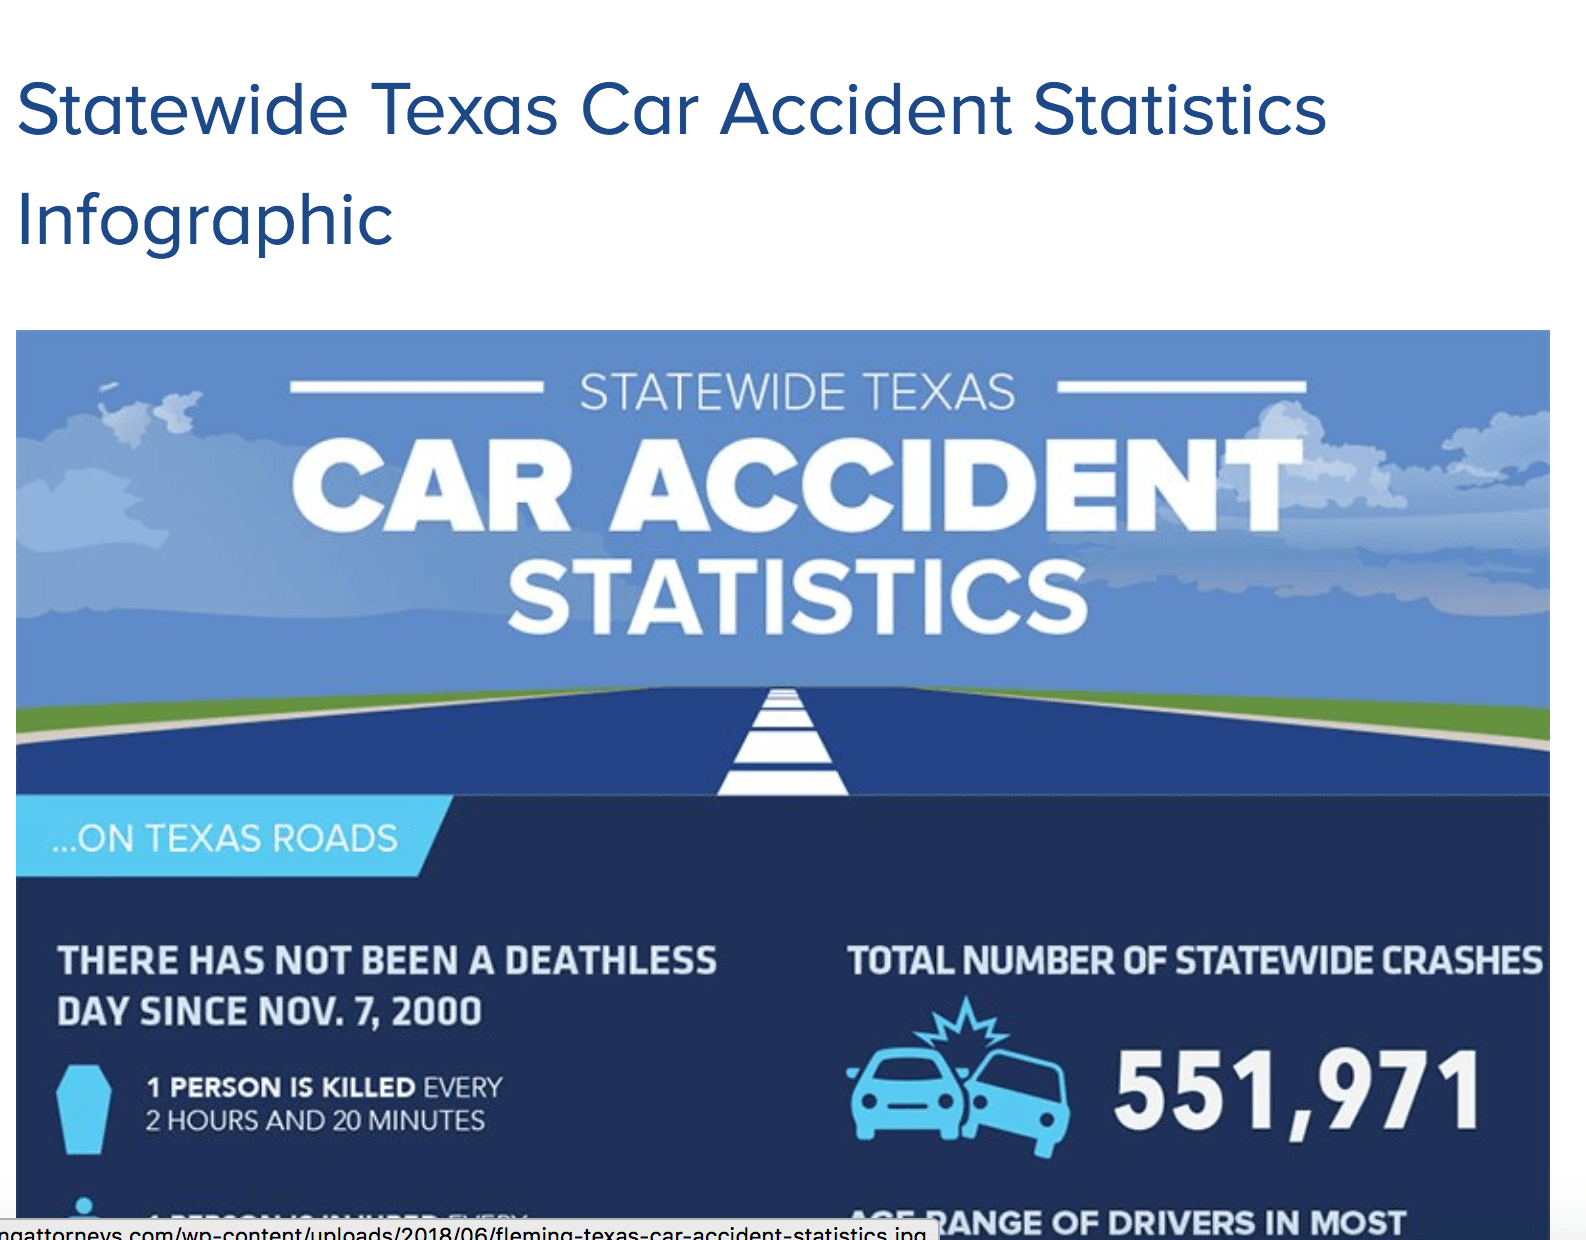
The state of Texas is one of the largest states in the US. It’s known for its diverse landscape and high tourist attractions. As great as Texas may seem, it hasn’t seen a day without a fatality on its roads since the year 2000. Texas car accident infographic illustrates even more alarming statistics. In Texas, someone is killed every 2 hours and 20 minutes, someone is injured every 1 minute and 59 seconds, and there happens to be a crash occurrence every 57 seconds.
These statistics are alarming and raise questions as to why these types of accidents, injuries, and fatalities are occurring.
Common Causes
According to the information in the infographic, the most common causes of Texas car accidents vary. These factors range from unsafe lane changes, speeding, following too closely, failure to yield, and inattentive drivers. This type of driving behavior could raise additional questions as to why drivers seem to partake in such reckless driving habits.
In 2016, 987 people were killed as a result of drunk driving accidents. This is approximately 26 percent of the total of people killed in automobile crashes in Texas.
To accommodate for 26 percent of the entire number of fatalities that occurred on Texas roads, is a clear indication that impaired driving is among a one the highest leading contributors in the state of Texas.
Takeaways
With the leading contributors of automobile accidents in mind, it’s important to consider where exactly these accidents take place. 436,748 was the total number of car accidents that took place in Texas cities and town in this year. Of this total, roughly 76 percent of these crashes took place in urban areas and 72,100 fatalities and injuries occurred. See below for the top five cities with the highest crash numbers:
- Houston, Texas- Houston tops the cake at over 12 percent of the total Texas crashes and over 15 percent of total crashes in cities and towns.
- San Antonio, Texas- San Antonio follows quickly behind at over 8 percent of the total crashes and over 10.5 percent of total crashes in cities and towns.
- Dallas, Texas- Dallas takes third place in the top five cities with almost 6.5 percent of total crashes and 8.11 percent of total crashes in cities and towns.
- El Paso, Texas- El Paso is next with over 3 percent in total crashes.
- Fort Worth, Texas- Finally, Fort Worth takes fifth place as the highest number of crashes in Texas at almost 3 percent total number of Texas crashes.
Of these top cities, it’s also important to make note of is the city with the most fatalities:
- Houston
- Dallas
- San Antonio
- Fort Worth
- Austin
Considering the statistics, it’s obvious to point out that Houston can be considered the most dangerous city for driving in the state of Texas. Houston have the highest reported number of accidents and the most fatalities and injury collisions than any other location in the state.
This infographic illustrates some of the devastating statistics of roadway accidents, injuries, and fatalities. It’s important to consider your safety and the safety of others. Upholding safety as a priority can make the difference of avoiding and accident and saving a life.
Infographic Link: http://flemingattorneys.com/blog/statewide-texas-car-accident-statistics-infographic/