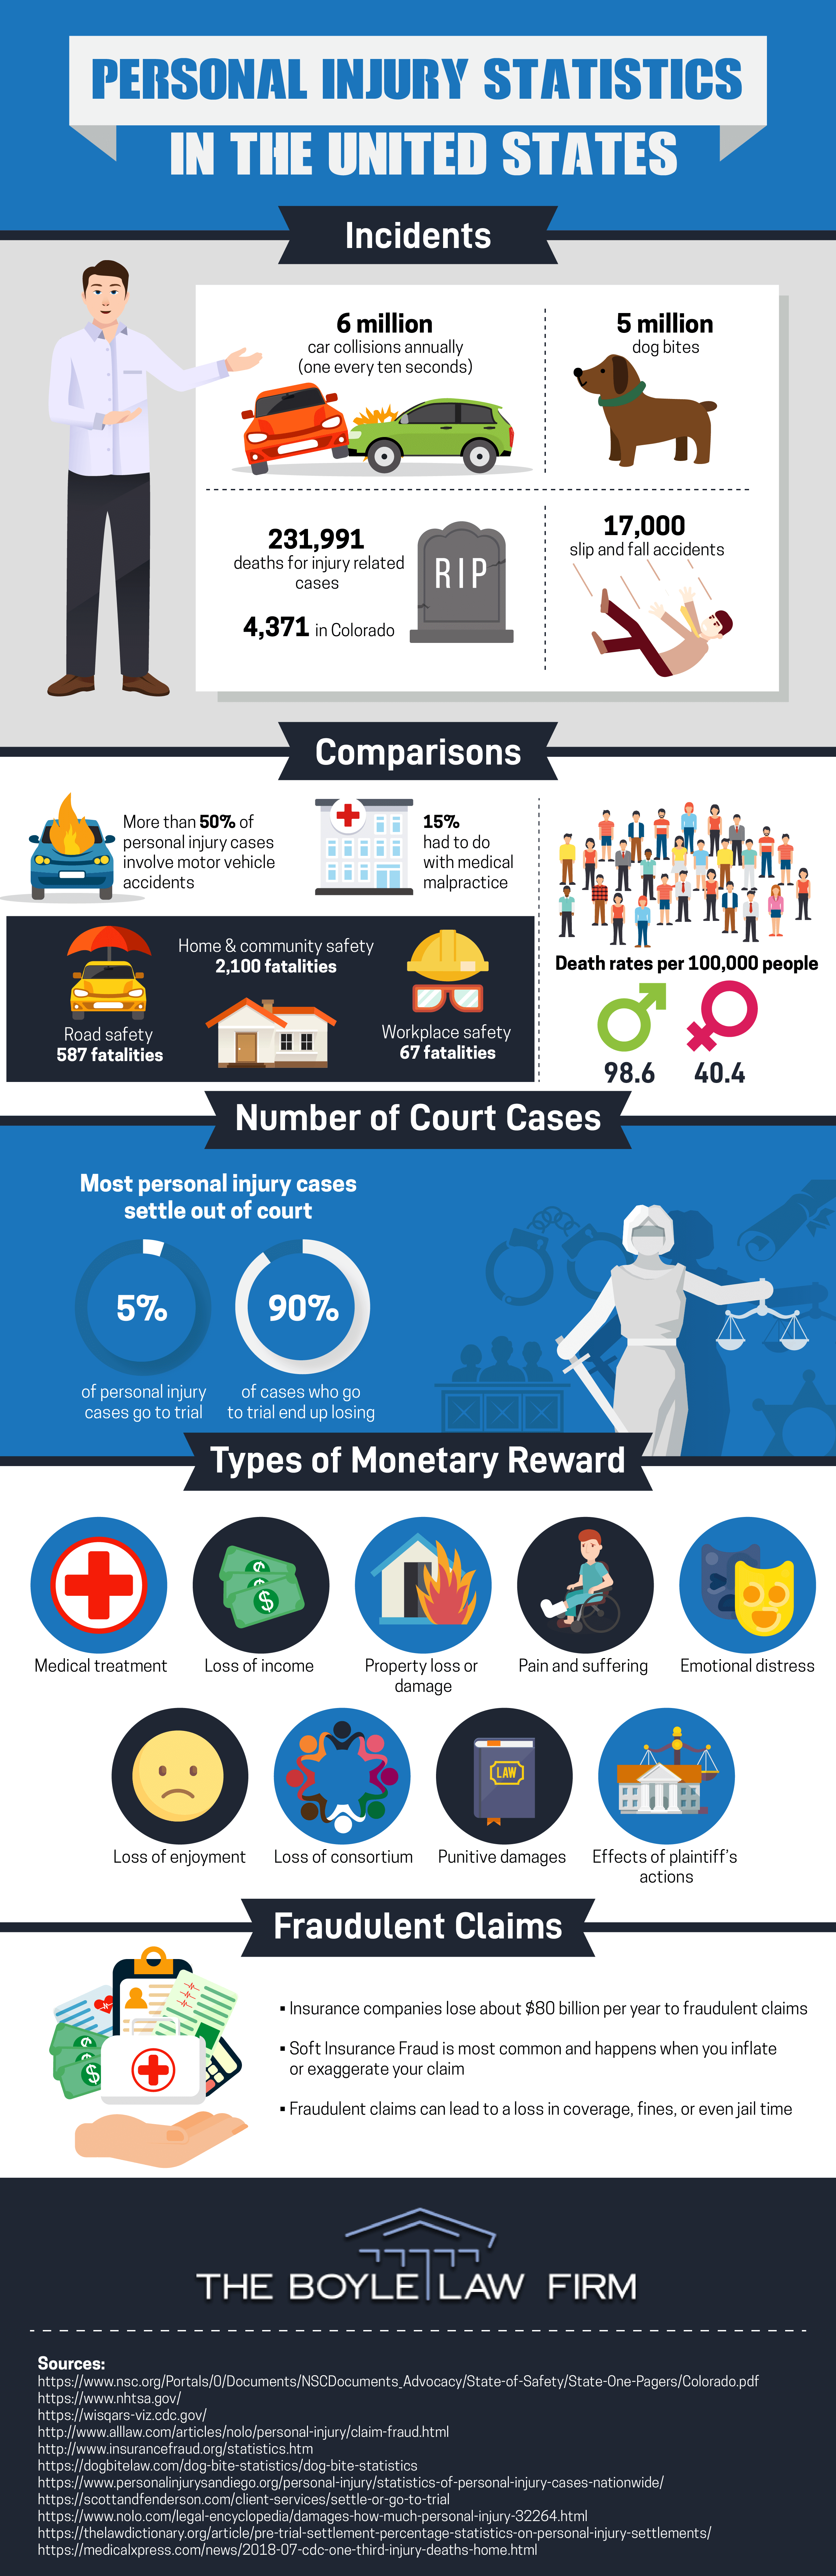
Personal injuries are one of the leading causes of litigation in the United States. But the causes of these injuries vary greatly, and the details of the ensuing lawsuits are bound to vary as well.
This infographic will acquaint you with the most common types of personal injuries, the demographics most often affected by each, and the success rates when the issue is brought to trial.
Based on the information contained herein, you will be better equipped to make a decision as to how you would like to handle your own personal injury case, or that of a friend or loved one.
Whether your personal injury is due to a motor vehicle collision, medical malpractice, a slip, and fall accident, or something else altogether, it’s important to know that you have options.
Do your research and consider carefully, and make sure you work with a personal injury attorney with the knowledge and experience to help you get the results you deserve.