This Infographic from Accengage (the European leader for Push Notifications on Mobile Apps, Websites and Facebook Messenger) helps Mobile Marketers and CRM Managers evaluate the performance of their Push Notification opt-in rates and reaction rates on iOS and Android, when compared to other players in their respective industry: travel, finance, entertainment, media, e-commerce, etc.
On iOS, the average opt-in rate reaches 41%. However, on Android, the study reveals that it is equal to 100%, as all Android users are automatically opted-in for push notifications when they download an app.
The Accengage Push Notification Benchmark also shows how mobile app push notification opt-in and reaction rates actually differ depending on the Continent and Country. Based on the results, Europe is the continent with the highest reaction rates (16.5% on Android and 5.25% on iOS), whereas Asia is last (9% on Android and 3.2% on iOS).
At the end of the infographic, Accengage gives 10 best practices to help marketers improve their Push Notification performance by optimizing opt-in rates and reaction rates thanks to A/B testing, effective targeting, personalization, pressure management, CRM interconnections, automation, etc.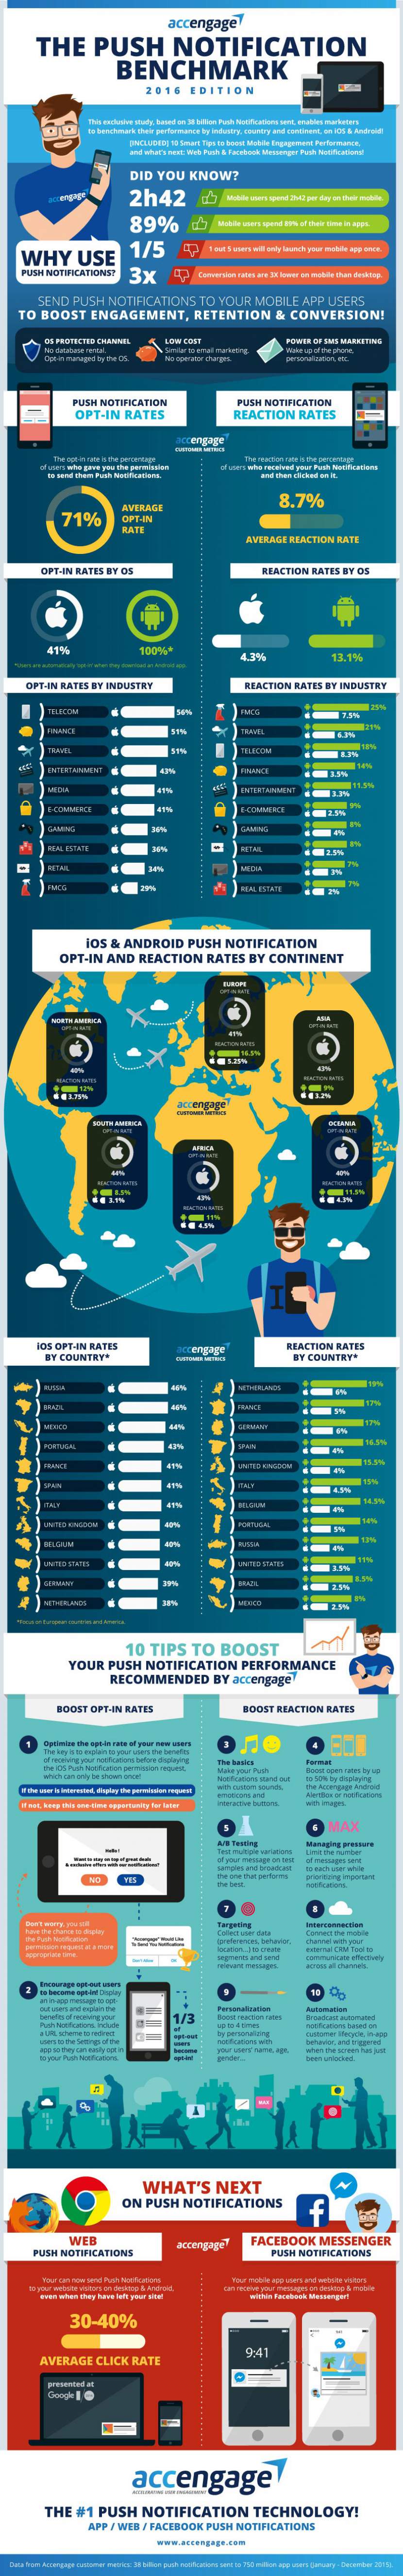
Infographic Source: https://www.accengage.com/benchmark-your-push-notification-opt-in-and-reaction-rates-on-ios-and-android-by-industry-and-country/
The Push Notification Benchmark for Mobile Apps – 2016 Edition
June 28, 2016