With the phenomenal rise in the number of mobile devices and the wide adoption of social media, buyers’ journey has become so complex. Consumers use multiple devices in the path to make purchase decisions that has made businesses guess consumer behavior across multiple devices. This infographic gives you a brief introduction to the concept of connected customers and the scientific methods in which the cross-device conversion can be tracked.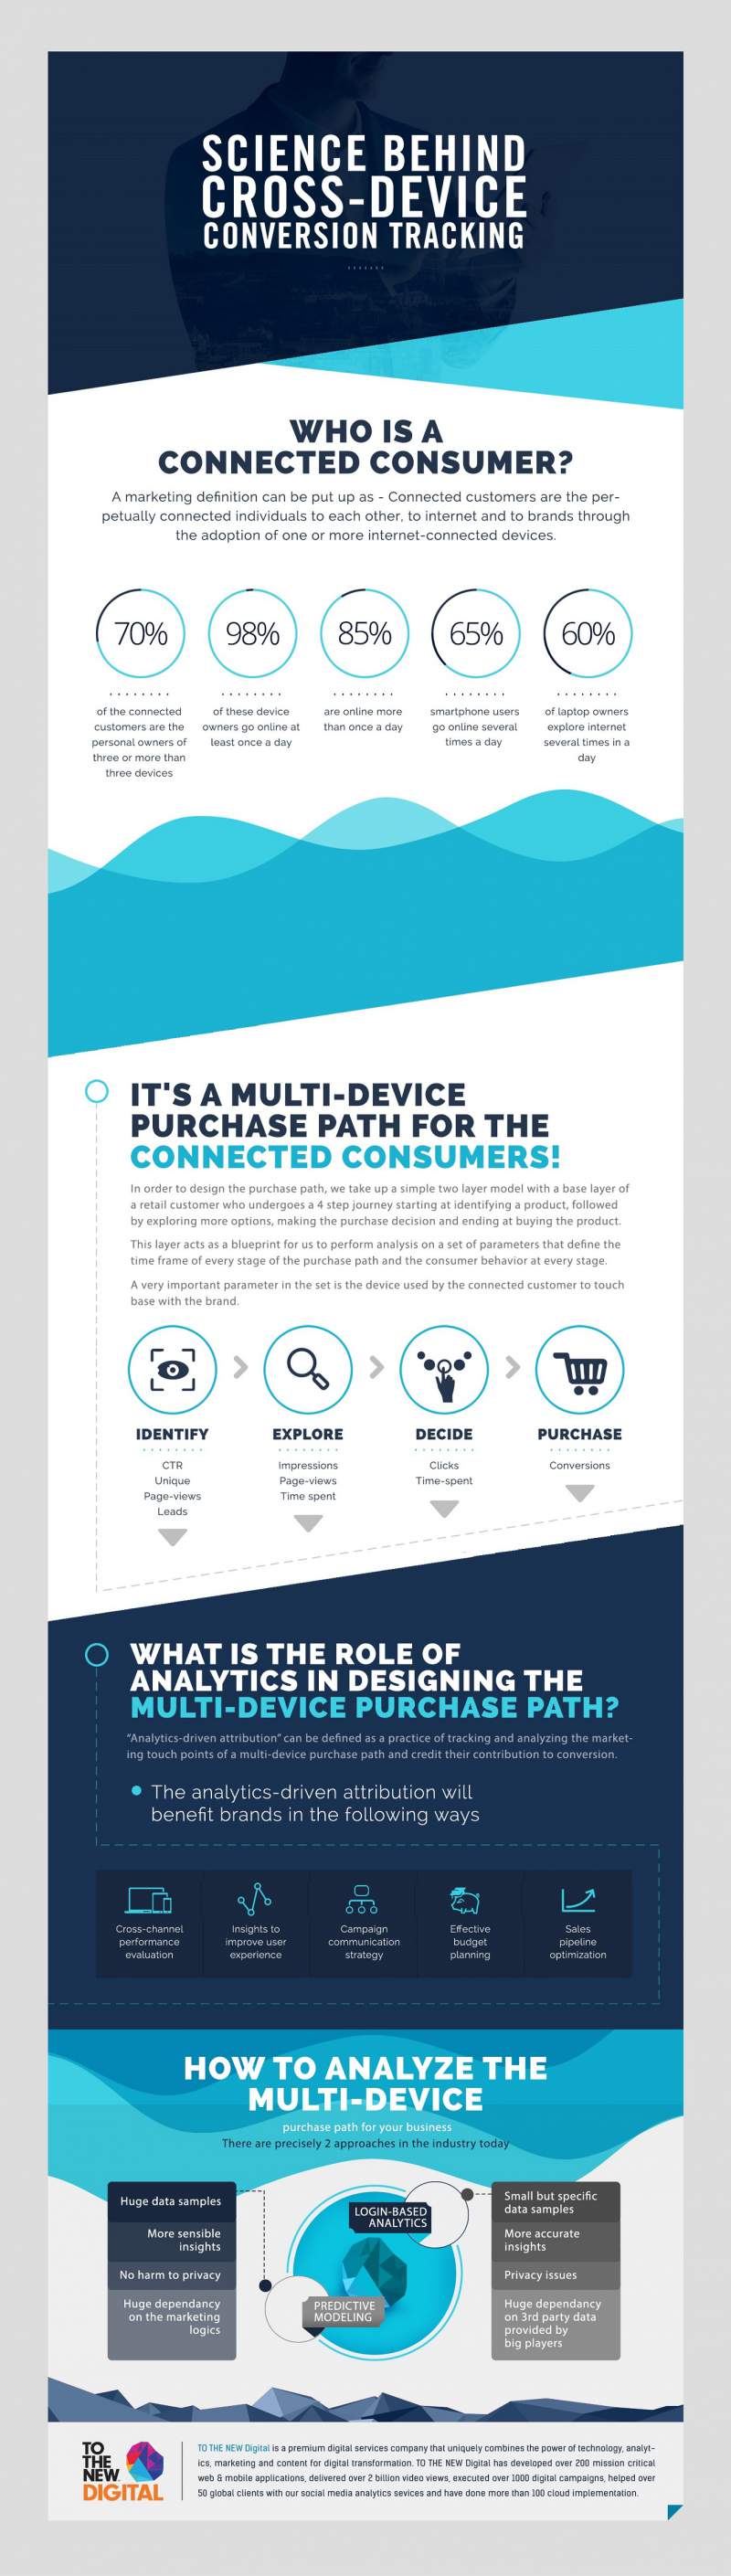
Infographic Source : http://www.tothenew.com/blog/infographics-multi-device-conversion-analytics/
The Science Behind Cross-Device Conversion Analytics
December 8, 2015